Take a Virtual Murder Tour of Medieval London
You’ll find that churches offer little sanctuary.

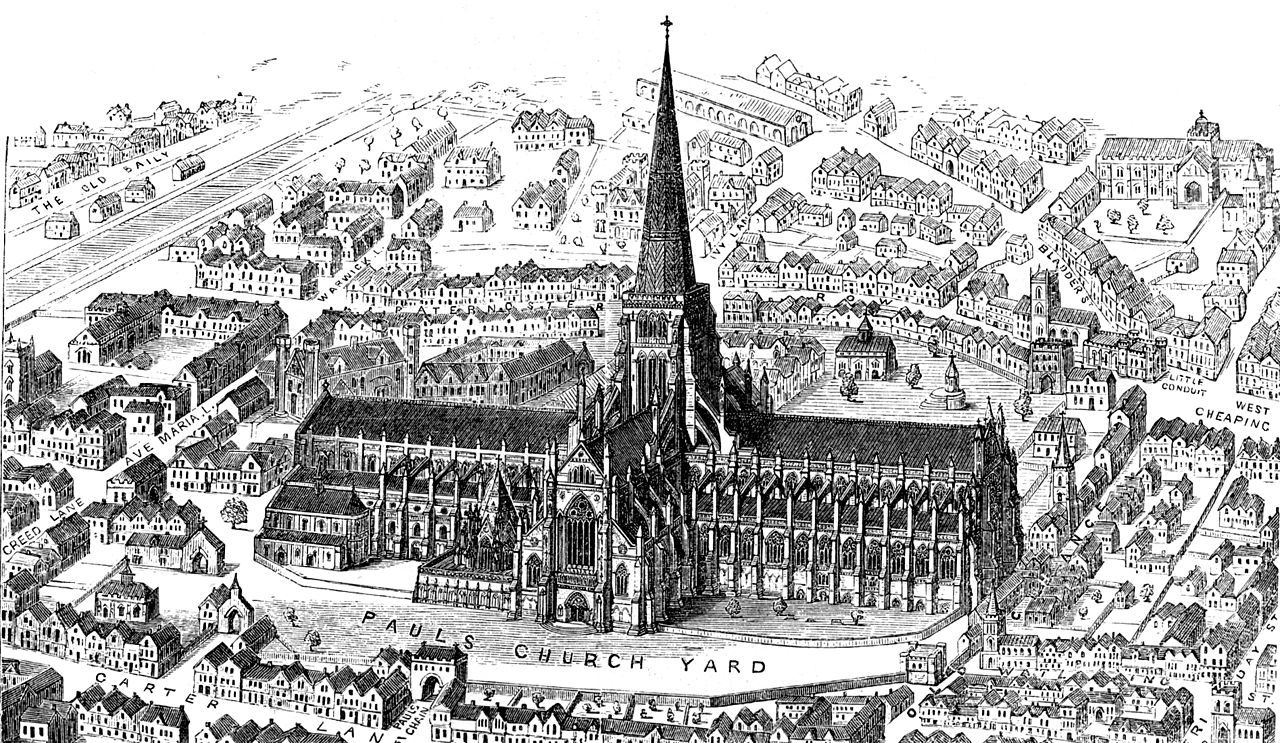
In late October 1323, on the eve of the feast of Saints Simon and Jude and in the shadow of St. Paul’s Cathedral in London, a heist went awry. According to the coroner’s report, a Frenchman known as John de Chartres had just supped with his accomplices, William of Woodford and his wife Johanna, at their Milk Street residence. They crept over to Bread Street and broke into the home they had targeted, and systematically looted it as planned. But then William noticed that “John was then filled with remorse.” Unable to risk a rat, William politely asked John to light a fire in the kitchen. As John knelt over the flames William hit him with an ax, and then attempted to burn the evidence—namely, John.
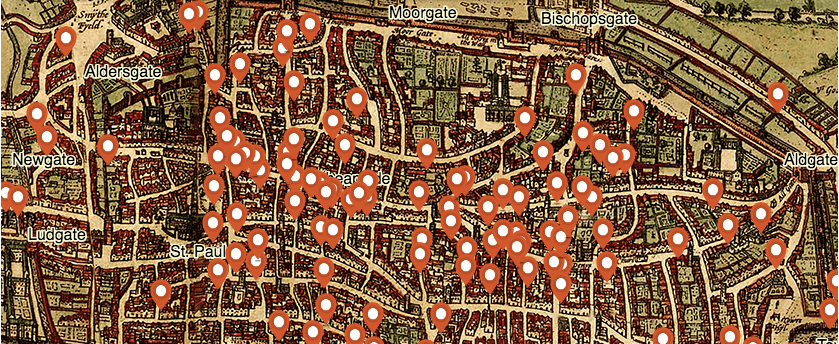
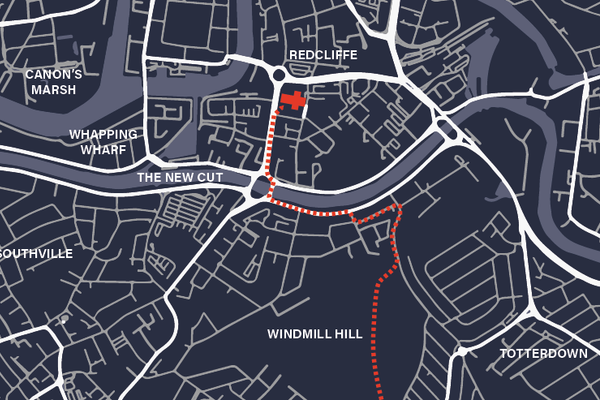
This is one of 142 tales of medieval mayhem and murder that you didn’t know you needed. They’re all now at your fingertips thanks to an interactive map of London that launched today, courtesy of the University of Cambridge’s Violence Research Centre. The map, designed by the director of the center, Manuel Eisner, pinpoints the spots (or close approximations) where murders occurred in the first half of the 14th century, and allows users to filter homicides by the victim’s gender, type of crime scene, year, weapon, and location. The data come from coroners’ reports issued between 1300 and 1340.
Jumping around the map is like flipping through a medieval penny dreadful, each click providing a new tale of murder and misery: bloody revenge over a stolen tunic, a fishmonger stabbed by his mistress, and even a man killed by a chaplain, after being found “sitting with” the chaplain’s lover. But Eisner has also compiled some handy statistics to provide a sense of the big picture: 76.8 percent of murders were committed between the hours of 5 and 10 pm, 52.8 percent of them took place in public streets or squares, 56.3 percent involved knives long or short, and 31 percent of them went down on Sundays. This is most likely, explains the Violence Research Centre, because people had extra time to drink and play games on Sundays—both of which can be engines of interpersonal conflict. It’s also worth noting that six murders took place in taverns—the same number as in religious buildings. Brothels only logged two. There was just one murder by projectile, when a servant indiscriminately fired an arrow into a quarreling crowd and killed a skinner named Simon de la Fermorie.

In all, London’s annual homicide rate during this period is about 15 to 20 times higher than what the researchers would expect of an equally populated city in today’s United Kingdom. It’s an interesting comparison, but, as the center notes, fairly misleading. We have more advanced means of killing, but also much more advanced emergency care, and how those balance out is anyone’s guess.
What is clear is that some of London’s most mundane spots have seen an awful lot of death. Thanks to maps such as Eisner’s and Historic UK’s plague pit map (showing where the bodies were buried after an outbreak of plague in the 1660s killed 100,000 residents), you can always know where you stand—though you might not want to.


Follow us on Twitter to get the latest on the world's hidden wonders.
Like us on Facebook to get the latest on the world's hidden wonders.
Follow us on Twitter Like us on Facebook